We plotted 72 graphs total, 24 each of:
Raw metric scores: 6 metrics * 2 MT systems * 2 translation types.
Pairwise vs Pivot differential: 6 metrics * 2 MT systems * both ± ways.
DeepL vs Google Translate differential: 6 metrics * 2 translation types * both ± ways.
The raw metric scores, e.g. "BLEU Scores of Pairwise Translations on DeepL", assess directly what the metrics output. Pairwise vs Pivot differentials, e.g. "COMET Differential between Pairwise and Pivot Translations on Google Translate", indicate how much better (or worse) pairwise translations perform with respect to pivot translations. Finally, 'for fun', we measured the performance of Google Translate versus DeepL by plotting differentials as well.
We came to the following conclusions or observed the following correlations:
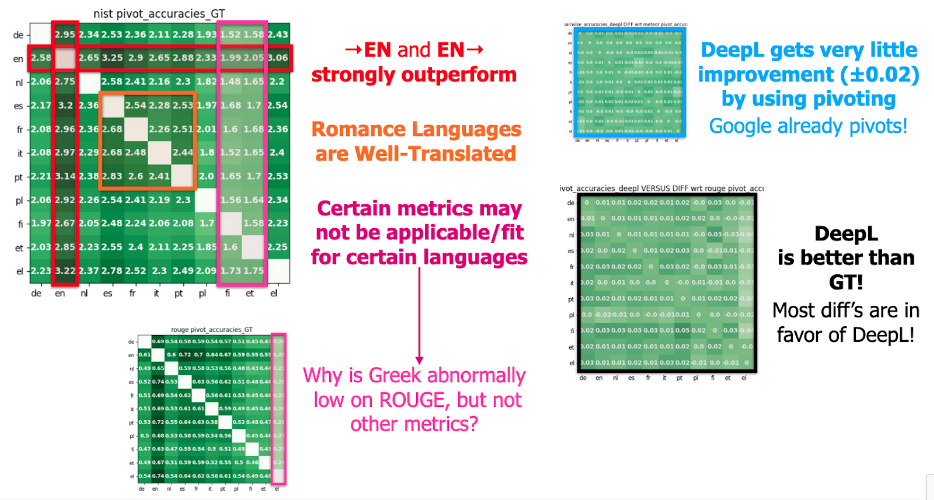
#1 English outperforms the rest. Across the board, translations to and from English produced better results. This makes translation language pivoting, with English as the pivot language, appear promising. One can see this as the two dark green lines at "en" in raw metric plots.
#2 Romance languages are well-translated. This particularly tight-knight language family enjoys relatively better translation within the 12 intra-family pairs than without. Some MT systems already incorporate e.g. a bit of Italian in the Spanish neural network.
#3 Either some metrics might not be fit for assessing certain languages, or MT systems are systematically bad at translating into them. There is a mysterious, systematic dip for NIST performance for translations into Finnish and Estonian; ROUGE also exhibits an unexplained abyss at translations into Greek. For ROUGE, this dip is particularly large, but other metrics do not have such a phenomenon; thus, it is likely that ROUGE should not be used for "A → EL" translations. However, as many metrics have a dip for Finnish and Estonian, it is more likely that MT systems need improvement in this area, rather than this being the fault of metrics. After all, we did select metrics to cover a wide space of what it means for translations to be 'accurate'.
#4 Pivot translations barely help DeepL, if at all. The pairwise-pivot differential graphs for DeepL show almost no change from pairwise to pivot, with metrics almost always exhibiting ±0.02 change and less than 2% improvement. (Raw, unstandardized NIST translations sometimes show +0.05 improvement, but it must be remembered that NIST scores are around 2 to 3, so the difference is 1-2 percent at best.) Pivot translation improvement is statistically insignificant, as these differentials are smaller than even the differentials between "A → B" accuracy and "B → A" accuracy. Also, note that Google Translate is well-known to use pivot translations, hence the near-uniform green coloring of GT plots and the labels "±0.0".
#5 DeepL is better than Google Translate! The clear majority of cells in the DeepL-GT graphs show DeepL victorious across all metrics. All "DeepL vs GT" graphs have almost all positive numbers in their cells (except TER, which is supposed to be—and indeed is—negative; see our methods for a quick explanation); all "GT vs DeepL" graphs, the opposite.
Here are sample illustrative plots. The "from language" is the row (see left-side language labels); the "to language" is the column (see bottom language labels). For example, in the NIST DeepL Pairwise Accuracy graph, translations from Portuguese (PT) to Greek (EL) have accuracy 2.62, while translations from EL to PT have accuracy 2.59. To see all 72 plots, visit our code (coming soon).
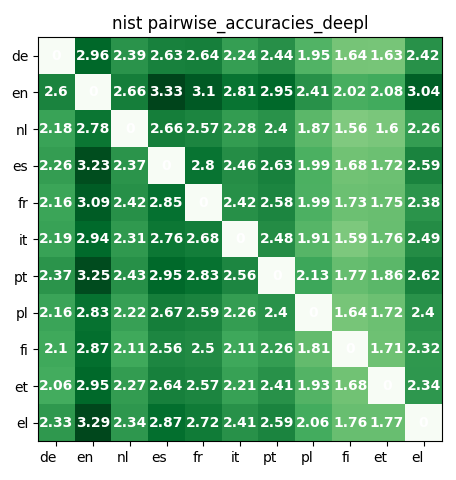
NIST DeepL Pairwise Translation Accuracy. Note how English distinctly outperforms other languages!

BLEU Google Translate Pivot vs Pairwise Accuracy Differential. Notice how these are almost all zeroes!

METEOR DeepL Pivot vs Pairwise Accuracy Differential. Improvements are negligible, if any; the difference is not statistically significant.

COMET Pairwise Translations: DeepL vs GT. Notice DeepL outperforms GT across the board, especially in translations to French and Italian!